Animated Graphic
Static Infographic
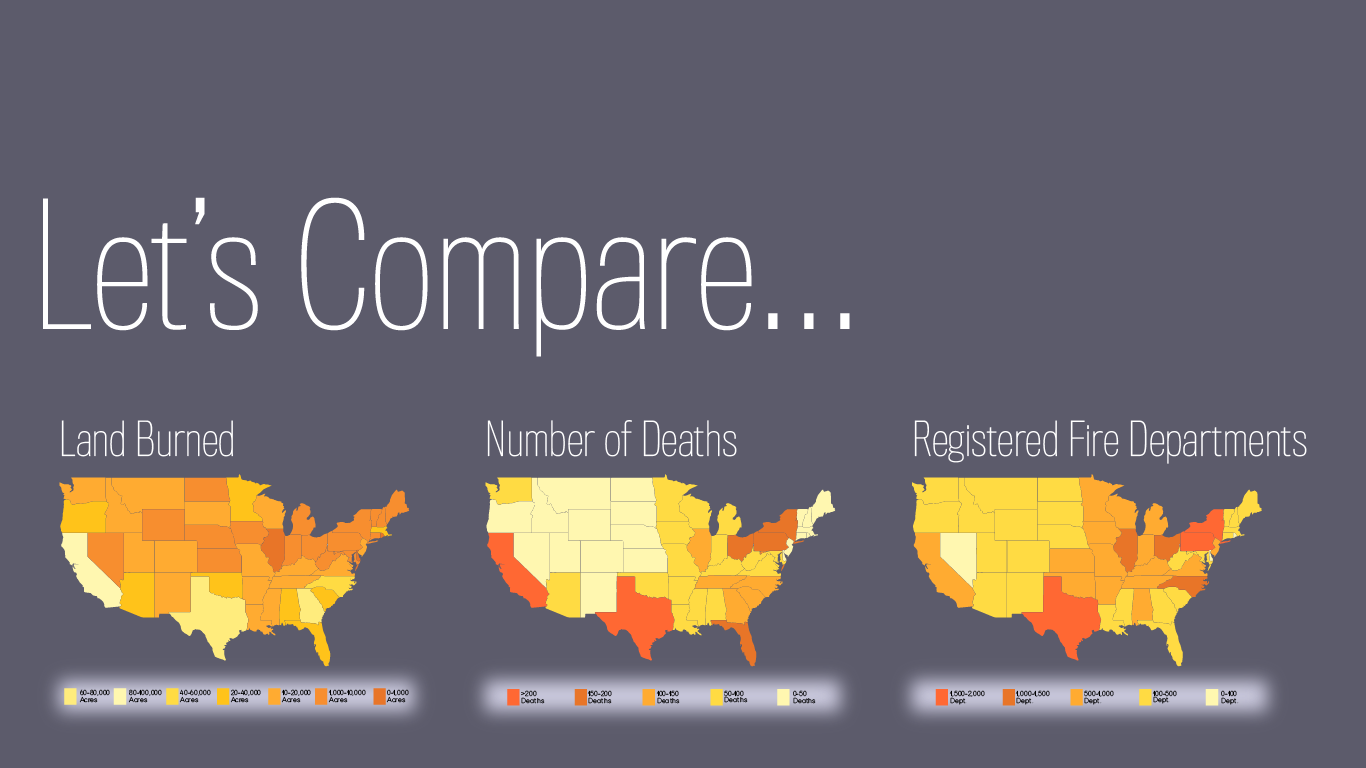
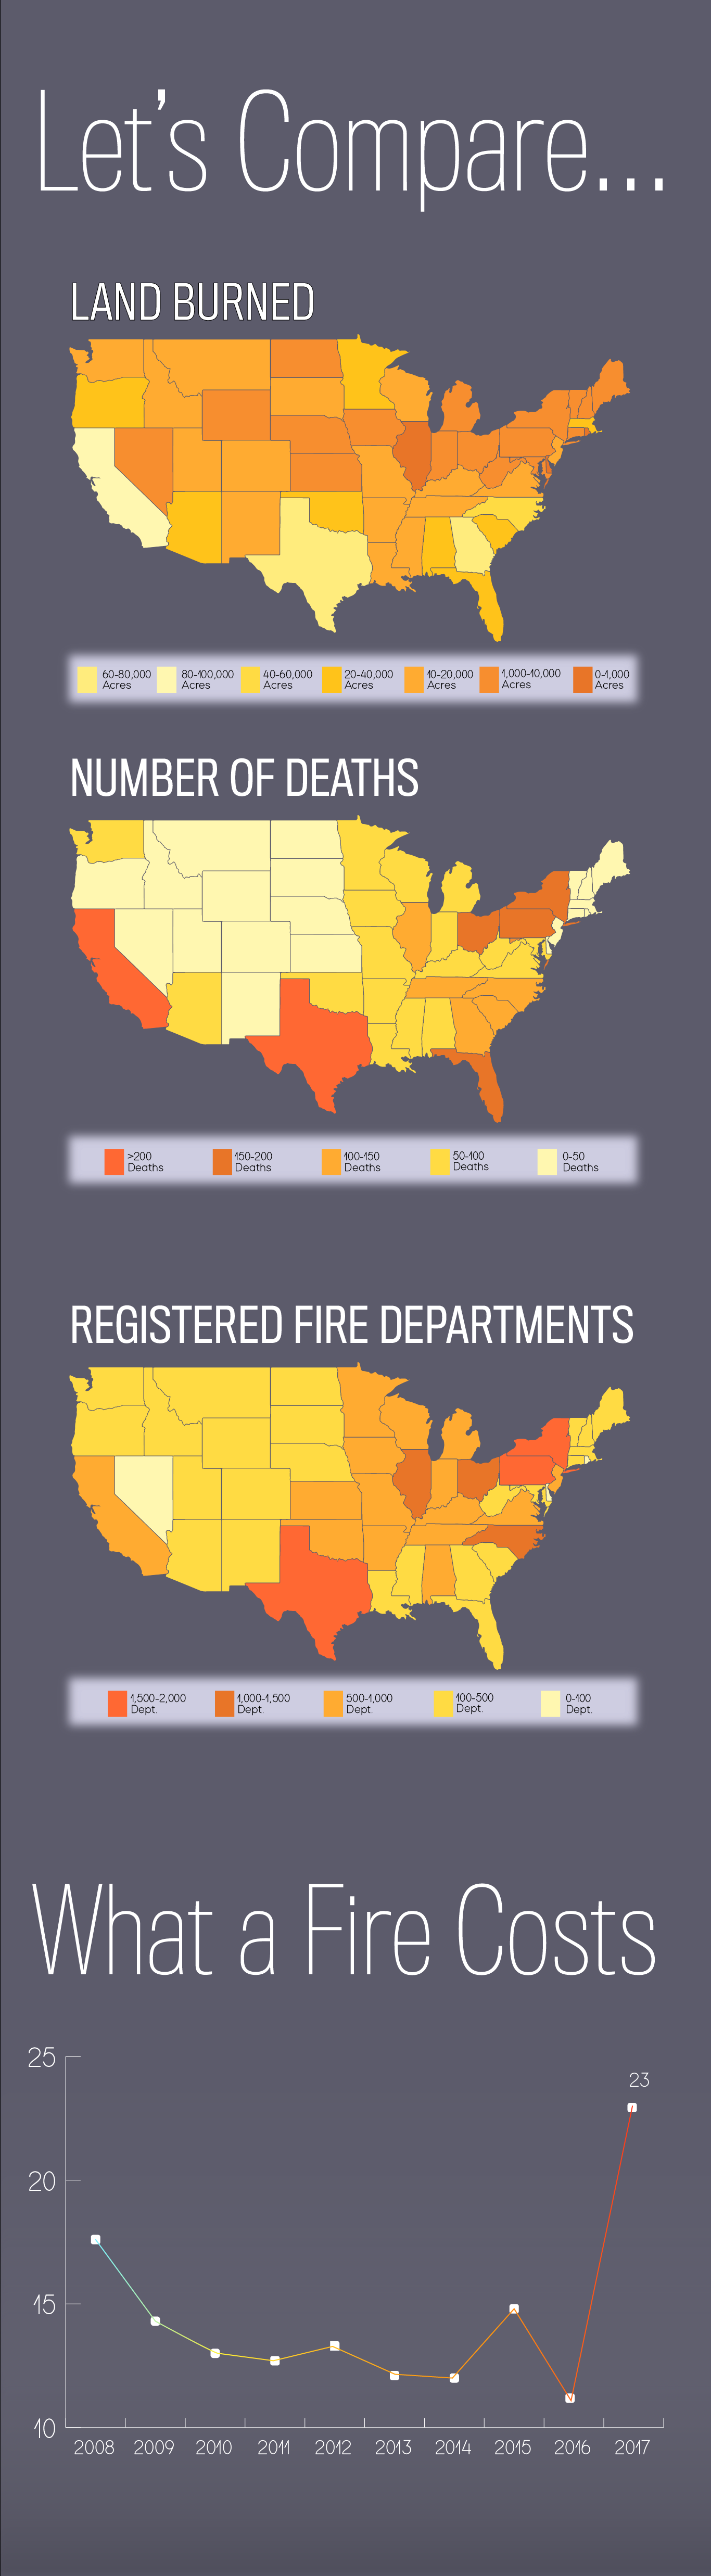
This infographic series, created for a class project, was crafted to show different sides of fire in America. It covered topics around firefighter fatalities, the number of fire departments per state and the acres of land burned. Adobe Illustrator, Adobe After Effects, Tableau and Excel were used to create the pieces.